

Spatial Transcriptomics Software: 6 Tools and Platforms That Can Come in Handy
If you're getting started, you've probably come across a wide range of spatial transcriptomics tools for processing and analyzing spatial data. However, with so many options available, it can be difficult to know which tools are best suited for your analysis. In this blog, we will introduce 6 useful spatial transcriptomics tools, including what each tool provides, what questions it can help answer or the types of spatial analysis workflows they are best suited for.
Before You Start...
If you’re new to the space, or want a more structured foundation, we’ve created a beginner-friendly e-book to guide you through the spatial transcriptomics analysis workflow. It walks you through different types of spatial transcriptomics technologies and the step-by-step spatial transcriptomics data analysis workflow, helping you understand not just what to do, but why each step matters.

First of all: What is spatial transcriptomics?
If you're completely new to spatial transcriptomics, you may want to start with a simple question: What exactly is spatial transcriptomics?
Briefly, spatial transcriptomics is a molecular profiling technique that shows which genes are active and exactly where they are active within a tissue. Unlike traditional gene-expression methods where you lose spatial coordinates, spatial transcriptomics keeps the information about the physical location of cells and genes. It thus can help researchers understand gene activity in single cells in the tissue context, such as how nearby cells communicate with each other or how gene expression changes in healthy vs. diseased areas. With such applications, one of its ultimate goals is to help you identify potential biomarkers that may be useful for diagnosing diseases or predicting their progression.

Key considerations when choosing your spatial transcriptomics tools
You have got the basics; now the question is: Which spatial transcriptomics tools do you need to get the insights? Before jumping into any decision, you may need to establish a connection between your spatial transcriptomics tool choice and your experimental setup:
Is your spatial transcriptomics tool suitable for your data type?
Different hardware platforms generate fundamentally different data structures. For example, 10x Visium outputs spot-based multi-cell resolution data, while newer platforms like CosMx provide single-cell or subcellular resolution. Hence, you may prefer tools that can accurately align reads and spatial coordinates with histological images for your specific platform.
Can it merge different analysis types?
A single dataset rarely answers every biological question. You may often want to integrate outputs from different sources, such as using a single-cell RNA-seq reference dataset to deconvolute spot-based spatial data and accurately map specific cell types; that means it would be nice if your chosen spatial transcriptomics tool can handle multi-modal data integration.
What's your research objective?
Some spatial transcriptomics tools are designed to only serve a specific analysis type; for example, cell2location in Python is designed specifically for clustering, pseudo-time-space trajectories, and cell-cell interaction. Choosing an analysis method thus needs to be based on what you want to investigate (is it spatial gene patterns, cell types, cell-cell interactions, or disease-related changes?).
6 spatial transcriptomics tools that can come in handy
The bioinformatics community has rapidly developed robust software ecosystems to handle different challenges of spatial data. Here we have put together a selection of useful spatial transcriptomics tools for you to explore.
Seurat
Question it helps answer: “Can I use my scRNA-seq reference to identify cell types in this spatial dataset?”
This is a widely used, comprehensive R package originally built for single-cell analysis that has expanded significantly to handle spatial transcriptomics data. Seurat features direct integration with outputs from platforms like Space Ranger, MERSCOPE, or CosMx, and offers robust modules for data pre-processing, normalization, spatial clustering and visualization. Therefore, this spatial transcriptomics tool is best known for its integration of single-cell & spatial workflows. There is actually one potential drawback of using Seurat, which is its high memory usage when processing particularly large datasets.
If you are a researcher who has been familiar with R programming, this tool can be a good choice.

Bioconductor (SpatialExperiment)
Question it helps answer: “How does the spatial expression pattern of a gene differ between healthy and diseased samples?”
This ecosystem of R-based packages supports different stages of spatial transcriptomics analysis. In other words, it provides a collection of tools for working with spatial transcriptomics data. Some commonly used packages include scater, edgeR, and BayesSpace. Some tools such as edgeR and scater are not exclusive to spatial transcriptomics and are also widely used in single-cell analyses.
Bioconductor also provides a standardized data structure called SpatialExperiment for storing spatial transcriptomics data, so you can manage and compare data across multiple samples and research methods more easily.
Because of that, Bioconductor is best suited for teams that are proficient in R and need a robust framework for managing multiple datasets within a shared analysis pipeline.

Giotto
Question it helps answer: “Can I align several tissue slices and reconstruct them into a 3D tissue?”
Another spatial transcriptomics tool to look at is Giotto, an R-based spatial transcriptomics tool for studying spatial gene-expression data from different spatial transcriptomics technologies. It is platform-agnostic, meaning you can use it regardless of which technology or hardware was used to generate the data.

This spatial transcriptomics tool offers a wide range of methods, from cleaning and processing spatial data to exploring expression co-localization. One of its unique features is its interactive viewer, and it can also handle computationally intensive tasks through Docker or cloud computing. It is also particularly strong for spatial registration or 3D reconstruction and spatially oriented analysis.
C-DIAM
Question it helps answer: “I have no prior coding experience; can I know where and how genes, cell types, and biological pathways are spatially distributed across tissues?”
For researchers looking for a more accessible way to analyze spatial transcriptomics data, C-DIAM Multi-omics Studio platform provides an interactive, no-code platform for different types of spatial technologies, ranging from 10x Visium and Visium HD, Stereo-seq analysis, to Xenium and CosMx SMI.

It offers an end-to-end workflow covering end-to-end workflow: preprocessing, quality control, integration, visualization, and downstream analysis in one platform. Another feature is its ability to combine public and in-house datasets, so that you can integrate spatial data with other omics datasets and validate potential targets, biomarkers, pathways, and ligand–receptor pairs across studies.
With its web-based interface and pre-built workflows, C-DIAM can be particularly useful if you want to perform spatial transcriptomics analysis without extensive programming experience.
Squidpy
Question it helps answer: “Which cell types preferentially occur next to each other?”
You may have heard of Scanpy, the popular Python package for analyzing single-cell gene-expression data. Squidpy is also Python-based, but it is specifically designed for spatial transcriptomics analysis. In practice, these 2 tools are often used together. (Scanpy actually can also handle basic spatial data like Visium.)
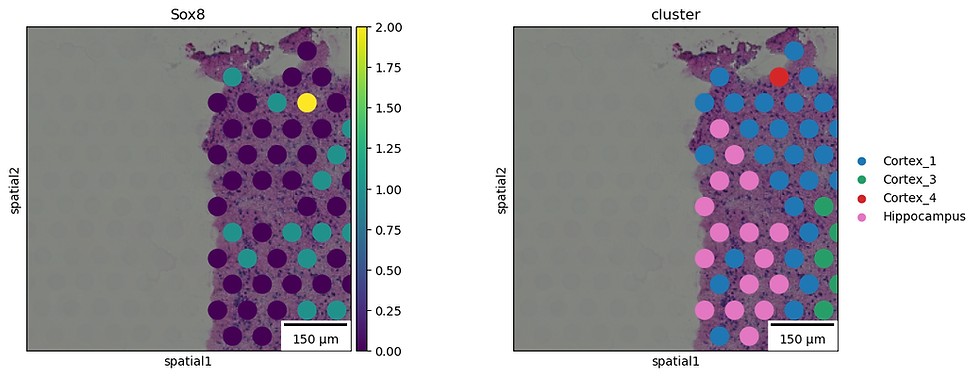
Because Squidpy adds spatially focused graph and image analysis to the Python/scverse workflow, its major strength is analyzing relationships between cells or cell types based on their physical location, rather than focusing only on gene expression. Therefore, it is useful if you want to build spatial graphs (i.e., maps of cells based on their physical locations) to study which cells are close to each other, whether certain cell types tend to be found together more often than expected, or simply just to get a more complete picture of the tissue. For this spatial transcriptomics tool, it helps to have some experience with Python, especially if you want to integrate it with other Python-based data science libraries.
SpatialData
Question it helps answer: “Can I overlay my H&E image, segmentation, transcript coordinates and cell annotations?”
SpatialData is a Python-based framework for storing, organizing, and managing complex spatial omics data, rather than a tool focused mainly on analysis. It can bring together gene expression, microscopy images, cell segmentation, spatial coordinates, and annotations in one standardized structure.
Unlike Bioconductor, which provides a broad collection of packages for data analysis and statistics, SpatialData mainly provides the data infrastructure that other analysis tools can use. For example, SpatialData can store an H&E image, cell-segmentation boundaries, transcript coordinates, and gene-expression data together, while spatial transcriptomics tools such as Scanpy or Squidpy can then perform the actual analysis. It is best suited for users working with large, complex, or multimodal spatial datasets who need consistent data organization across different tools. However, its main drawback is that it has a steeper learning curve and requires other tools for many advanced biological analyses.

Above are some useful, including end-to-end, spatial transcriptomics tools to help you get started. If you found this blog useful, you may also want to check out our other spatial transcriptomics articles here: Spatial transcriptomics anaslysis.
If you’re also interested in single-cell RNA-seq data analysis but don’t have coding experience, our C-DIAM Multi-Omics Studio platform provides an easy-to-use interface and single-cell analysis toolkits to help you get started. Join a demo to learn more!


Comments