Easy. Collaborative. Comprehensive.
Xenium in situ spatial transcriptomics data analysis can be complex and resource-intensive. It often requires advanced coding skills, custom workflows, and significant time to manage large and detailed spatial datasets. On top of that, sharing results with collaborators usually involves cumbersome file transfers and version tracking.
With CDIAM, you can start analyzing Xenium data instantly through an intuitive graphical interface and pre-built analytical workflows. Share datasets and results effortlessly via simple links, making collaboration smooth and immediate—all while ensuring your analysis is complete and reliable.

Why choose CDIAM for 10x Genomics Xenium data analysis?
Simple deployment and access
CDIAM is an SAAS framework - meaning no installation. You can access the platform anywhere via common web browsers: Chrome, Firefox, Edge, Safari, you name it. The platform can be deployed either behind your organizations' firewall or using private cloud configurations.
Microservices for customization
The microservice-based architecture of CDIAM enables bespoke development, integration with public or internally built pipelines and tools (like R shiny data visualization applications) or even the ability to bring CDIAM capabilities to existing in-house computational resources.
Graphical user interface for ease of use
CDIAM aims to make it easier for all scientists to interpret and leverage the values of omics data. Thus, it is built in an interactive and intuitive graphical UI that is accessible to all biologists, regardless of their programming skills.
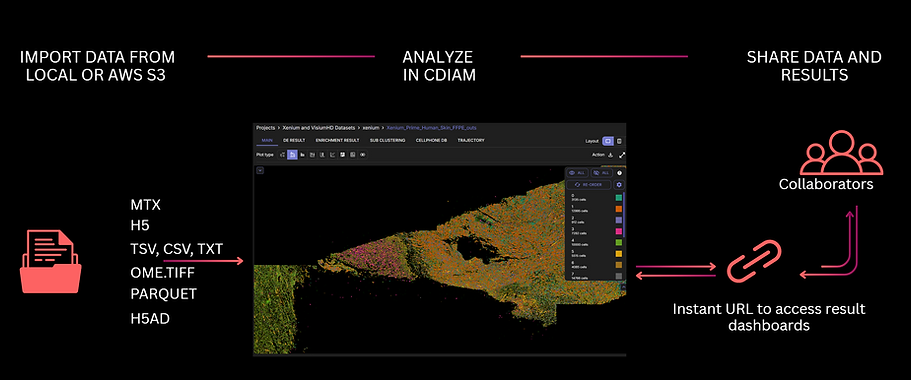
Flexible input formats. Flexible sharing and collaboration.
Data management and analysis -All in one place
The platform manages the data as individual datasets or groups them in ‘projects’. Multi-omics data in a ‘project’ can be collectively analyzed for aggregate insights, or individually explored. Examples of such aggregate insights include: top ligand-receptor pairs, top cell types interacting with each other, overlapping significant pathways, potential targets, etc. commonly found across experiments.
CDIAM supports a wide variety of input formats, from count matrices, gene tables, DE results, to Seurat and Scanpy objects - enabling seamless integration with existing in-house analytics workflows. Seurat and Scanpy object adaptability, together with link sharing functions, empowers easier collaboration among team members.
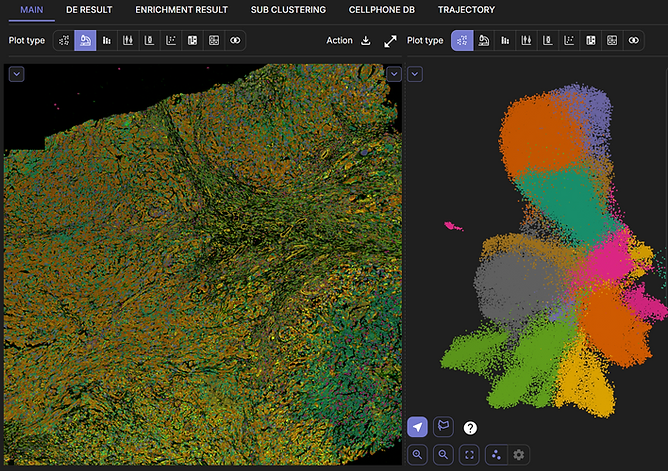
Explore Xenium spatial data from end to end -in a platform that anyone can master
Get all the essentials for Xenium data exploration in one single intuitive platform, from pre-processing, QC-ing, integrating to visualizing the data and downstream analysis.


QC and preprocess your Xenium data
Explore the distribution of your expression data through various QC plots; perform filtering, normalization, highly variable gene selection and dimensionality reduction with PCA and UMAP.
Annotate populations of interest
Annotate cell groups on the UMAP and view how they are spatially distributed on the tissue slide.
Cluster and subcluster cell populations
Adjust clustering resolution and cluster your data using the Leiden clustering algorithm. Sub-clustering enables more detailed focus on a region of interest on the tissue slide.
Multichannel image view and settings
Adjust channel colors on multi-channel images
Find marker genes, DEGs and enriched pathways
Find DE genes and enriched pathways for a population of interest using Reactome, Wikipathways, NCI PID or custom gene sets.
Assess co-expression and cell-cell communication
Study intercellular signalling and calculate gene coexpression scores across cell clusters.
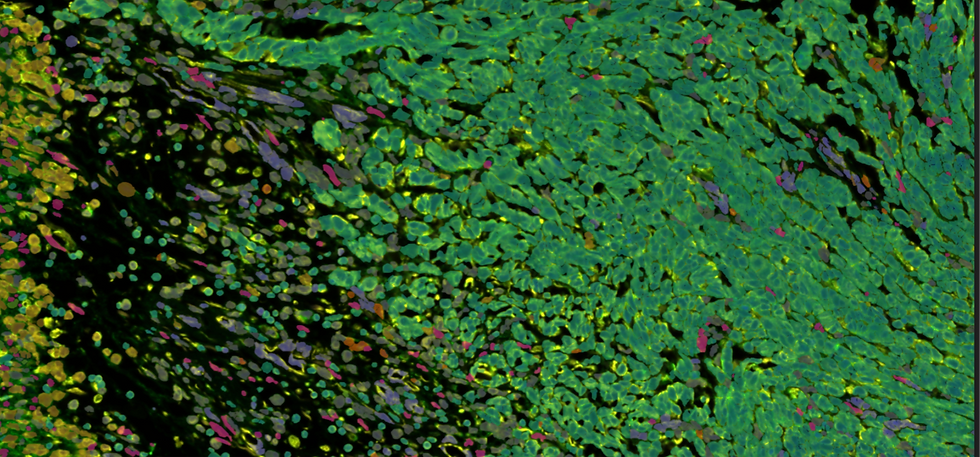
Overlay expression and polygons on morphology images
Add and view high-resolution morphological images with cell segmentation results with expression values on top.
Predict cell types
Automatically predict cell types using SingleR or Azimuth. Users can select a custom dataset to be the reference for the prediction.
Prioritize targets & validate biomarkers
Find and score potential targets and biomarkers through Pathway2Targets and Biomarker2Validate pipelines.
Collaborate seamlessly
With flexible data import and link sharing
Scanpy object import
Beside feature-barcode matrices, users can submit Scanpy objects (.H5AD) as an input for Xenium spatial transcriptomics data - enabling adapability with in-house analysis pipelines and reinforces collaboration among bioinformaticians and bench scientists.
Link sharing
CDIAM enables effortless sharing of data and results via simple URLs, giving collaborators instant access to datasets and analyses.

Skip the hassle of large file import
Seamlessly import high-resolution Xenium morphology images using CDIAM command-line interface (CLI) and AWS S3 bucket connectivity.
Cross-validate insights with published data
CDIAM integrates in itself a curated database of public spatial transcriptomics as well as other omics data, where you can interactively access and copy public datasets to your own projects for integration.
Some of the available databases:
10x Genomics Spatial Visium
Pythia curated scRNA-seq database
CosMx

Recount3
CPTAC
Where Xenium meets multi-omics
CDIAM is designed for multi-omics data analysis and integration. Xenium spatial data in a project can be collectively analyzed with other omics datasets and experiments for aggregate insights. Easily summarize and validate DE genes, targets, biomarkers, ligand-receptor pairs and pathways across different studies and experiments.


Analyze any where. Collaborate any time.
Access and analyze your data on the web
CDIAM is a web platform, meaning that you can access it and analyze the data any time, any where.
Share and collaborate easily
Collaborate seamlessly with your team members through convenient sharing and collaboration options, such as URLs and shared project notebooks.
Discover important insights with CDIAM
Request a trial now to start analyzing your multi-omics data with CDIAM Multi-Omics Studio.
Talk to a regional distributor